Quick answer
Wind energy's main pros are low cost (unsubsidized onshore wind at $37–86/MWh, Lazard 2025), zero fuel and zero operating emissions, and a large resource: US wind produced 464,000 GWh in 2025 (EIA). The main cons are variable output (about a 34% capacity factor), wildlife collisions, noise, visual impact and hard-to-recycle blades.
Key facts
- 464,000 GWh of US electricity came from wind in 2025, up 3% on 2024 (EIA).
- 33.8% average capacity factor for US wind in 2025, versus 91.1% for nuclear (EIA).
- $37–86/MWh unsubsidized cost of onshore wind (Lazard LCOE+, June 2025).
- 140,000–328,000 birds a year killed by US turbines (Loss et al., 2013), against roughly 2.4 billion by cats.
- 2.2 million tons of cumulative US blade waste projected by 2050 (NREL, 2021).
On this page
- What are the pros and cons of wind energy?
- What are the advantages of wind energy?
- What are the disadvantages of wind energy?
- How does wind energy compare with solar and fossil fuels?
- How can the disadvantages of wind energy be reduced?
- Are wind turbines worth it overall?
- History of the wind energy debate
- Scientific references
- Bottom line
- Frequently asked questions
Wind power is now a mainstream source of renewable energy in the United States, supplying roughly one-tenth of utility-scale electricity. That scale means its trade-offs are no longer theoretical. This guide weighs the advantages of wind energy against its disadvantages using measured data: generation from the US Energy Information Administration (EIA), costs from Lazard, wildlife studies published through the US Geological Survey (USGS), and waste projections from the National Renewable Energy Laboratory (NREL).
A wind turbine is a machine that converts the kinetic energy of moving air into electricity. The rotor blades turn a shaft connected to a generator in the nacelle, the housing on top of the tower. A wind farm (or wind plant) is a group of turbines connected to the grid at one point. For the physics of how much power a rotor can capture, see our wind energy guide.
What are the pros and cons of wind energy?
Wind energy is cheap, clean and abundant, but it is variable and has real local impacts on wildlife, landscapes and neighbors. The table below summarizes the evidence; each row is covered in detail further down.
| Pros of wind energy | Cons of wind energy |
|---|---|
| Low cost: $37–86/MWh unsubsidized onshore (Lazard, 2025) | Variable output: 33.8% average capacity factor (EIA, 2025) |
| No fuel and no emissions while operating | Bird and bat collisions, especially migratory bats |
| Large domestic resource: 464,000 GWh in 2025 (EIA) | Noise and shadow flicker near homes |
| Small physical footprint; land can still be farmed | Visual impact on landscapes and coasts |
| Fast to build and no water used for cooling | Blades are hard to recycle (2.2 million tons by 2050, NREL) |
| Hedge against fuel price swings | Needs transmission lines from windy, remote areas |
The balance looks different for a utility wind farm than for a backyard turbine. The cons that matter most for homeowners, such as low wind speeds and tower height limits, are covered in our guide to the home wind turbine.
What are the advantages of wind energy?
The main advantages of wind energy are low and stable cost, zero operating emissions, and a large domestic resource. Here is what the data shows for each.
1. Wind is one of the cheapest sources of new electricity
The levelized cost of energy (LCOE) is the average cost per unit of electricity over a plant’s lifetime, including construction, financing, operation and fuel. Lazard’s June 2025 LCOE+ report puts unsubsidized onshore wind at $37 to $86 per megawatt-hour. That range overlaps the low end of new gas-fired generation, and wind has no fuel bill at all.
Lazard also noted that onshore wind costs rose in the 2025 edition compared with 2024, reflecting higher interest rates, equipment and supply-chain costs. Wind is still competitive, but it has not followed solar’s steady downward path in every year.
2. No fuel, no combustion emissions
Once built, a wind turbine burns nothing. It emits no carbon dioxide, sulfur dioxide, nitrogen oxides or particulates while generating, and it uses no water for cooling, unlike coal, gas and nuclear steam plants. Lifecycle emissions come mainly from manufacturing steel, concrete and composites, and from transport and construction. An NREL-led review of 49 studies put wind’s harmonized median at about 11 g CO2-equivalent per kWh (Dolan & Heath, 2012), and NREL’s 2021 update found coal releases about 20 times more greenhouse gas per kWh than wind, solar or nuclear on a median basis. This is why wind sits alongside solar and hydropower in the clean energy mix.
3. A large and growing domestic resource
According to EIA, US wind farms generated 464,000 GWh in 2025, 3% more than in 2024. Wind and utility-scale solar together supplied a record 17% of US utility-scale generation in 2025, or 19% when small-scale rooftop solar is included. Wind is the largest single source of renewable energy electricity in the US, ahead of hydropower.
4. Land around turbines stays productive
Turbines are spaced widely to avoid robbing each other of wind, but the equipment itself occupies little ground. NREL’s study of US wind plants found an average permanent direct impact of about 0.3 hectares (0.74 acres) per megawatt, mostly roads, with additional temporary disturbance during construction (Denholm et al., 2009). Farmers and ranchers keep cropping or grazing between turbines and earn lease payments from the wind developer.
5. Price stability and energy security
Because there is no fuel, a wind farm’s cost is locked in when it is built. Utilities and corporate buyers sign long-term power purchase agreements at fixed prices, which hedges against natural gas price spikes. Every kilowatt-hour from domestic wind is one that does not depend on imported fuel.
What are the disadvantages of wind energy?
The main disadvantages of wind energy are intermittent output, wildlife deaths, noise and visual impact, the need for new transmission, and blades that are difficult to recycle. None of these are deal-breakers at grid scale, but each has measurable costs.
1. Variable output and a modest capacity factor
The capacity factor is the energy a plant actually produces in a year divided by what it would produce running at full rated power every hour. EIA data shows:
| Technology | 2023 | 2024 | 2025 |
|---|---|---|---|
| Wind | 33.2% | 34.3% | 33.8% |
| Solar PV (utility-scale) | 23.2% | 23.2% | 24.0% |
| Nuclear | 93.0% | 90.8% | 91.1% |
Source: EIA Electric Power Monthly, Table 6.07.B (annual data).
A 100 MW wind farm therefore delivers, on average, the energy of a 34 MW plant running constantly. A low capacity factor is not a cost problem in itself, since the LCOE already accounts for it, but it means grid operators must plan for calm periods. They do this with weather forecasts, geographic diversity (the wind is usually blowing somewhere), flexible gas and hydro plants, and increasingly with battery storage. Wind also tends to peak at night and in winter, which complements solar energy.
2. Bird deaths
Wind turbines do kill birds, and raptors such as golden eagles are of particular concern because they are long-lived and slow to reproduce. Peer-reviewed estimates for the contiguous US, based on the 2012 fleet, are:
| Study (data year 2012) | Estimated birds killed per year |
|---|---|
| Loss, Will & Marra (2013) | 234,000 (range 140,000–328,000) |
| Erickson et al. (2014) | about 368,000 (upper estimate) |
| Smallwood (2013) | about 573,000 |
A USGS-led comparison (Johnson et al., 2016) concluded the three methods were reasonably consistent: roughly a quarter to half a million birds a year at 2012 build-out. Totals are higher today because there are more turbines.
The studies differ in method. Loss and colleagues pooled published fatality estimates for modern monopole turbines and found that deaths per turbine rise with hub height and are lowest in the Great Plains (Loss et al., 2013). Erickson’s team focused on small songbirds (passerines), which make up most carcasses found under turbines, estimating 134,000 to 230,000 small-passerine deaths a year; even for the most affected species, only about 0.043% of the population died annually from turbine collisions, far below the 1.2% to 9.0% they cite for communication towers (Erickson et al., 2014). Smallwood adjusted each project’s counts for carcasses removed by scavengers and missed by searchers, which pushes estimates higher (Smallwood, 2013).
For perspective, the same research group estimated that collisions with buildings kill a median 599 million birds a year in the US (Loss et al., 2014), and free-ranging cats kill about 2.4 billion (Loss, Will & Marra, 2013). Wind is a small share of human-caused bird mortality, but local impacts can be serious if a project sits on a migration corridor or near eagle nests, which is why siting studies matter.
3. Bat deaths
Bats are the larger wildlife problem. Smallwood (2013) estimated about 888,000 bat deaths a year at US wind facilities based on 2012 data, and a 2020 re-analysis using shorter carcass-search intervals put the 2014 figure near 2.2 million (95% confidence interval 1.77–2.72 million). A USGS-published review of 218 North American studies found the most affected species are migratory tree bats, namely the hoary bat, eastern red bat and silver-haired bat, with most deaths from July to October, a pattern first documented across North American sites by Arnett et al. (2008).
How operators cut bat deaths
Bats fly most on warm, low-wind nights in late summer. “Curtailment” means raising the cut-in wind speed so blades stay still or barely turn during those hours. Because little energy is available in light winds anyway, the lost generation is small. Ultrasonic acoustic deterrents on the nacelle are another tool now in commercial use.
4. Noise and shadow flicker
GE reports that a utility-scale turbine produces about 43 decibels at 300 meters (about 1,000 feet) and 38 decibels at 500 meters. That is comparable to a quiet room or a refrigerator. The sound is mostly aerodynamic swish from the blade tips rather than machinery. Some nearby residents report annoyance from the rhythmic pattern even at low decibel levels, and sound carries further at night when background noise drops.
Shadow flicker happens when the sun is low behind a rotating rotor and casts moving shadows through windows. It is predictable from geometry, so developers model it and can program turbines to stop during the few hours a year it would affect a specific house. Local ordinances usually set noise limits and setback distances from homes and property lines.
5. Visual impact: why are some people against wind turbines?
Most local opposition to wind farms centers on views, noise and shadow flicker, and wildlife, covered in this section and the ones above, rather than doubts that turbines work. Modern utility turbines are among the tallest structures in rural areas, so they are visible for miles. Visual change to rural landscapes, ridgelines and coastlines is the most common reason projects face local opposition. Required aviation lights add to this at night, although many new projects use radar-activated lighting that switches on only when aircraft approach.
6. Transmission and location constraints
The best wind resources in the US are in the Great Plains and offshore, often far from cities. Getting the power to customers needs new high-voltage lines, which take years to permit and build. Offshore projects bring their own trade-offs, covered in our offshore wind guide.
7. Blade waste and recycling
Roughly 85–90% of a wind turbine, according to an American Bar Association review, including the steel tower, copper wiring and gearbox, is conventionally recyclable. Blades are the exception. They are made of glass fiber or carbon fiber composites bonded with thermoset resin, which cannot simply be melted down. NREL’s 2021 analysis projected about 2.2 million tons of cumulative US blade waste by 2050, assuming a 20-year turbine life. NREL calculated that this equals about 1% of remaining US landfill capacity by volume and 0.2% by mass. Globally, Liu & Barlow (2017) projected about 43 million tonnes of cumulative blade waste by 2050, with China accounting for 40%, Europe 25%, the United States 16% and the rest of the world 19%, counting manufacturing scrap and test blades as well as retired ones.
Alternatives exist but cost more than landfilling today: grinding blades as a cement-kiln raw material and fuel, mechanical shredding into fillers, pyrolysis, and new thermoplastic or recyclable epoxy resins designed for easier end-of-life separation.
How does wind energy compare with solar and fossil fuels?
Wind costs about the same as utility solar per MWh, produces more energy per megawatt installed, and emits far less than fossil fuels over its lifecycle. The trade-off is that wind is lumpier and more site-dependent than solar.
| Factor | Onshore wind | Utility solar PV | Natural gas / coal |
|---|---|---|---|
| Fuel cost | None | None | Ongoing, volatile |
| Capacity factor (US, 2025) | 33.8% | 24.0% | Dispatchable |
| Operating CO2 emissions | None | None | High |
| Main local impacts | Birds, bats, noise, views | Land area, habitat | Air pollution, mining, water use |
| End-of-life issue | Composite blades | Panel recycling | Ash, mine reclamation |
For a head-to-head on cost, land and output, see wind vs solar. For a broader view of the two leading renewables, read our solar energy pros and cons and the comparison of renewable vs nonrenewable energy.
How can the disadvantages of wind energy be reduced?
Most of wind’s drawbacks can be cut by careful siting, smart operation and better materials. The industry and regulators use a standard set of steps:
- Pre-construction wildlife surveys. Developers follow the US Fish and Wildlife Service’s Land-Based Wind Energy Guidelines to map bird use, migration routes and bat activity before choosing turbine locations.
- Avoiding sensitive sites. Moving turbines off ridgelines used by raptors, or away from wetlands and roosts, reduces collisions at the source.
- Curtailment and deterrents. Raising cut-in speeds on high-risk nights and installing acoustic bat deterrents reduce bat deaths with little energy loss.
- Setbacks and noise modeling. Required distances from homes, plus modeling of sound and shadow flicker, address most neighbor complaints before construction.
- Storage and transmission. Batteries, pumped hydro and new lines smooth out variability and move power from windy regions to cities.
- Repowering and recycling. Replacing old turbines with fewer, larger ones on the same site, and contracting blade recycling, cuts land use and waste.
Are wind turbines worth it overall?
At utility scale, yes: wind is one of the lowest-cost sources of new electricity, and its environmental costs are small relative to the fossil generation it displaces. The benefits are diffuse (cleaner air, lower fuel imports, stable prices), while the costs are local (views, noise, wildlife near specific sites), which explains why wind is popular in surveys yet often contested at individual projects.
For a household, the answer depends almost entirely on your site’s wind speed and how high you can mount a turbine. Because power rises with the cube of wind speed, a site averaging 6 m/s (13.4 mph) yields about 73% more energy than one at 5 m/s (11.2 mph). Test your own numbers with the wind turbine calculator, and compare the alternatives in our guide to the advantages of renewable energy.
Why wind speed matters so much
Power in the wind is P = ½ × air density × swept area × wind speed³. Doubling wind speed gives 2 × 2 × 2 = 8 times the power. That cube law is why developers spend a year or more measuring wind before building, and why a few extra meters of tower height can transform a turbine’s output.
History of the wind energy debate
The trade-offs on this page are as old as wind power itself. Charles F. Brush ran a 12 kW wind dynamo in Cleveland, Ohio, from 1888, charging batteries for his mansion, and showed both wind’s promise and its main drawback: output that rose and fell with the weather. In 1941 the 1.25 MW Smith-Putnam turbine on Grandpa’s Knob, Vermont, fed a utility grid until a blade failed in 1945, an early lesson in materials and maintenance.
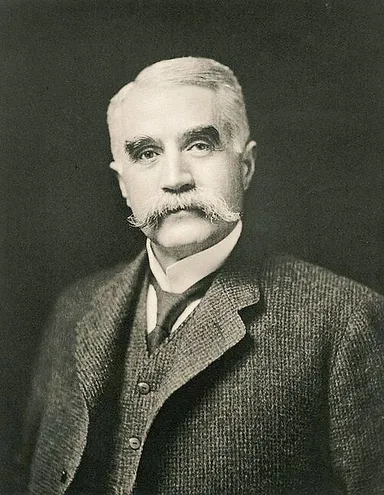
The modern industry grew out of the 1970s oil crises. California’s wind rush of the early 1980s put thousands of small turbines at Altamont Pass, and the raptor deaths recorded there in the following years made bird collisions a lasting research topic and shaped today’s siting guidelines. Denmark’s Vindeby, the first offshore wind farm, opened in 1991, moving turbines away from neighbors at higher cost. Since then, falling costs have answered the price objection, while variability, wildlife, noise and blade recycling remain the main debates.
| Year | Milestone |
|---|---|
| 1888 | Charles Brush’s 12 kW wind dynamo, Cleveland |
| 1941 | Smith-Putnam 1.25 MW turbine feeds the Vermont grid |
| Early 1980s | California wind rush; Altamont Pass bird studies follow |
| 1991 | Vindeby, Denmark, the first offshore wind farm |
Scientific references
- Loss, S. R., Will, T., & Marra, P. P. (2013). “Estimates of bird collision mortality at wind facilities in the contiguous United States.” Biological Conservation, 168, 201–209. doi:10.1016/j.biocon.2013.10.007
- Smallwood, K. S. (2013). “Comparing bird and bat fatality-rate estimates among North American wind-energy projects.” Wildlife Society Bulletin, 37(1), 19–33. doi:10.1002/wsb.260
- Erickson, W. P., Wolfe, M. M., Bay, K. J., Johnson, D. H., & Gehring, J. L. (2014). “A Comprehensive Analysis of Small-Passerine Fatalities from Collision with Turbines at Wind Energy Facilities.” PLOS ONE, 9(9), e107491. doi:10.1371/journal.pone.0107491
- Arnett, E. B., et al. (2008). “Patterns of Bat Fatalities at Wind Energy Facilities in North America.” Journal of Wildlife Management, 72(1), 61–78. doi:10.2193/2007-221
- Loss, S. R., Will, T., Loss, S. S., & Marra, P. P. (2014). “Bird–building collisions in the United States: Estimates of annual mortality and species vulnerability.” The Condor, 116(1), 8–23. doi:10.1650/CONDOR-13-090.1
- Loss, S. R., Will, T., & Marra, P. P. (2013). “The impact of free-ranging domestic cats on wildlife of the United States.” Nature Communications, 4, 1396. doi:10.1038/ncomms2380
- Liu, P., & Barlow, C. Y. (2017). “Wind turbine blade waste in 2050.” Waste Management, 62, 229–240. doi:10.1016/j.wasman.2017.02.007
Bottom line
Wind energy’s pros are strong and well documented: unsubsidized costs of $37–86/MWh (Lazard, 2025), no fuel or operating emissions, and 464,000 GWh of US generation in 2025 (EIA). Its cons are also real: a capacity factor around 34%, hundreds of thousands of bird deaths and possibly more than a million bat deaths a year in the US, noise and visual impact near homes, and composite blades that mostly end up in landfills. Good siting, curtailment, storage and new blade materials shrink those downsides. For most regions, wind is a core part of a low-cost renewable energy grid, and the remaining work is about where and how turbines are built, not whether they work.
FAQ
Frequently asked questions
What are the 3 main advantages of wind energy?
Wind power is among the cheapest new sources of electricity, at $37 to $86 per megawatt-hour unsubsidized for onshore projects in Lazard's 2025 analysis. It burns no fuel, so turbines emit no carbon dioxide or air pollution while running. And the resource is large and domestic: US wind farms generated 464,000 GWh in 2025, according to EIA.
What are the 3 biggest disadvantages of wind energy?
Output varies with the weather, so the average US wind farm delivered about 34% of its rated capacity in 2025. Turbines kill birds and bats, an estimated 140,000 to 328,000 birds a year in the US in one peer-reviewed study. And fiberglass blades are hard to recycle, with NREL projecting about 2.2 million tons of blade waste by 2050.
How many birds do wind turbines kill each year?
Peer-reviewed US estimates based on 2012 build-out range from about 140,000 to 328,000 birds a year (Loss et al., 2013) up to about 573,000 (Smallwood, 2013). Totals are higher today because more turbines exist. For comparison, the same research group estimated buildings kill a median 599 million birds a year and free-ranging cats about 2.4 billion.
Are wind turbines bad for bats?
Yes, bats are the bigger wildlife concern. Smallwood estimated about 888,000 bat deaths a year at US wind farms in 2012, and a 2020 re-estimate reached about 2.2 million for 2014. Migratory tree-roosting species such as the hoary bat are hit most, mainly from July to October. Curtailing turbines at low wind speeds on late-summer nights cuts bat deaths.
How loud is a wind turbine?
GE reports a utility-scale turbine produces about 43 decibels at 300 meters (about 1,000 feet) and 38 decibels at 500 meters, similar to a quiet room or a refrigerator hum. Measured levels vary with wind, terrain and turbine model, and some neighbors find the rhythmic swish annoying even at modest decibel levels, so setback rules matter.
Can wind turbine blades be recycled?
The steel tower, copper and most of the nacelle are routinely recycled, but blades are made of glass or carbon fiber composites that are hard to separate. Most retired US blades still go to landfills. NREL projects about 2.2 million tons of cumulative blade waste by 2050, roughly 1% of remaining US landfill capacity by volume. Cement co-processing and recyclable resins are emerging alternatives.
Does wind energy cause pollution?
Wind turbines release no air pollution or carbon dioxide while running. Emissions come from making steel, concrete and blades, transport and construction. NREL's review of 49 lifecycle studies found a harmonized median of about 11 grams of CO2-equivalent per kWh for wind, roughly a twentieth of coal-fired power on a median basis.
Why don't some farmers want wind turbines?
Many farmers host turbines for the lease income, but others object to the effect on farming. Turbines and access roads split fields and take some land out of production, and the National Agricultural Aviation Association says towers can make crop spraying by plane difficult or impossible nearby. Neighbors without a lease get the views and noise but no payment.
Is wind energy reliable?
A single wind farm is variable, but grid operators forecast wind output days ahead and balance it with other plants, storage and transmission. US wind farms averaged a 33.8% capacity factor in 2025 per EIA. Wind tends to blow harder at night and in winter, which complements solar's daytime and summer peak.
21 Sources
- EIA, Today in Energy: Wind and solar generated a record 17% of U.S. electricity in 2025 (March 2026)
- EIA, Electric Power Monthly Table 6.07.B, capacity factors (2023–2025 data)
- National Agricultural Aviation Association, policy on wind turbines
- Lazard, Levelized Cost of Energy+ (June 2025)
- Loss, Will & Marra, Estimates of bird collision mortality at wind facilities in the contiguous US (2013), via USGS comparison
- Loss et al., Bird–building collisions in the United States (The Condor, 2014)
- Smallwood, Comparing bird and bat fatality-rate estimates among North American wind-energy projects (2013)
- Smallwood, USA wind energy-caused bat fatalities increase with shorter fatality search intervals (Diversity, 2020)
- USGS, Factors associated with bat mortality at wind energy facilities in the United States (2017)
- GE, How loud is a wind turbine?
- NREL, Wind Turbine Blade Material in the United States: Quantities, Costs, and End-of-Life Options (2021)
- American Bar Association, Not Gone with the Wind: The Looming Turbine Blade Waste Problem
- Denholm et al., NREL, Land-Use Requirements of Modern Wind Power Plants in the United States (2009)
- NREL, Life Cycle GHG Emissions of Utility-Scale Wind Power: Systematic Review and Harmonization (Dolan & Heath, 2012)
- NREL, Life Cycle Greenhouse Gas Emissions from Electricity Generation: Update (2021)
- Loss, Will & Marra (2013), Biological Conservation 168:201–209
- Smallwood (2013), Wildlife Society Bulletin 37(1):19–33
- Erickson et al. (2014), PLOS ONE 9(9):e107491
- Arnett et al. (2008), Journal of Wildlife Management 72(1):61–78
- Loss, Will & Marra (2013), free-ranging cats, Nature Communications 4:1396
- Liu & Barlow (2017), Wind turbine blade waste in 2050, Waste Management 62:229–240
Published October 25, 2026 · updated October 25, 2026 by Izhar Ahmad Danish. Part of our renewable energy guide. Found an error? Tell us.